UPDATED, with response of Google
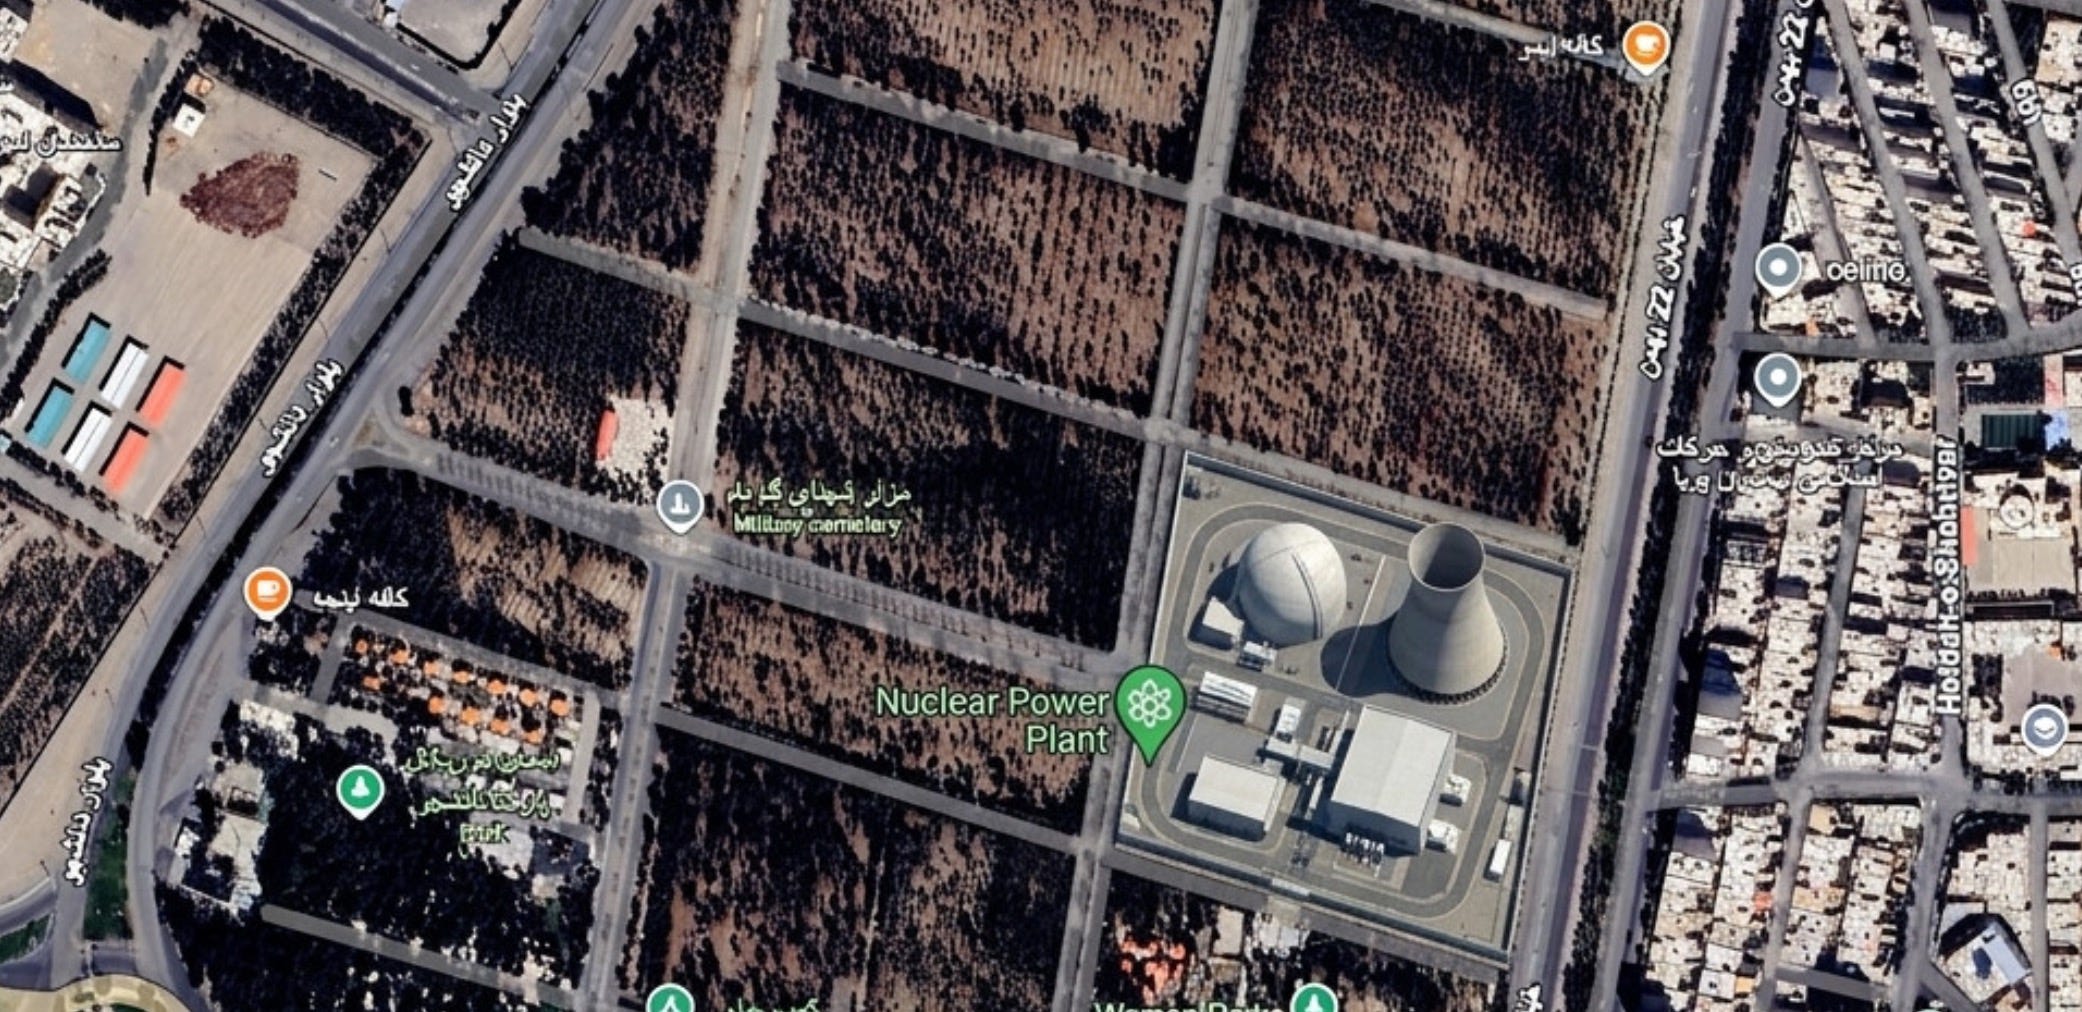
Tonight I typed just one sentence into Google Earth and put refugees near the Mexican border. Then I planted a nuclear plant in Iran. Then I put a fatal crash on a street in Amsterdam. Google’s own satellite imagery underneath all three. What on earth is Google doing?
Google spent twenty years building the reference the world checks against.
Today it added a button that makes things up. Google Earth on the web now has image generation built in, powered by Nano Banana 2. It went live today, worldwide, for everyone, with no waitlist and no application.
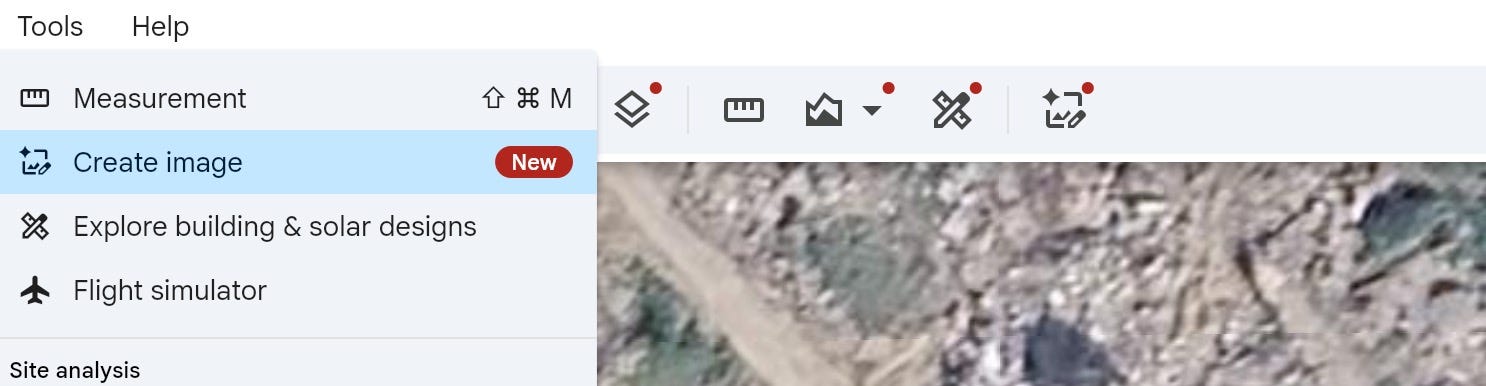
You open Google Earth. You zoom to any coordinates on the planet. You click create image. You type what you want to see. The model takes Google’s satellite, aerial and 3D imagery of that exact spot as its starting point and gives you back a photorealistic picture. If it isn’t quite right you refine it.
Google’s own description of the “fun feature” is that Nano Banana “creates concepts grounded in the real world.”
Grounded in the real world means the invented thing is welded to genuine coordinates, drawn on genuine imagery, often in the same colours and the same light and at the same angle as the picture beside it.
The forgery does not have to look convincing on its own. It inherits the credibility of the map it was born on.
The announcement of 487 words, written by Bryan Horowitz, Product Manager, Google Earth from just a few hours ago baffled me. His instruction to the planet is six words long:
type whatever you want to see
That is the gate. That is the whole gate.
Elsewhere in the same post he suggests it’s fun to let your imagination run wild.
The post opens by asking whether you have ever looked at an empty lot in your neighbourhood and imagined a community garden. It closes by telling you to pick a spot on the map and start bringing your ideas to life.
It is live in every country tonight. Free. No application.
Somebody is going to bring an idea to life before morning. It will not be a community garden, trust me.
This new feature will guaranteed lead to governments, factions fighting infowars, trolls etc.
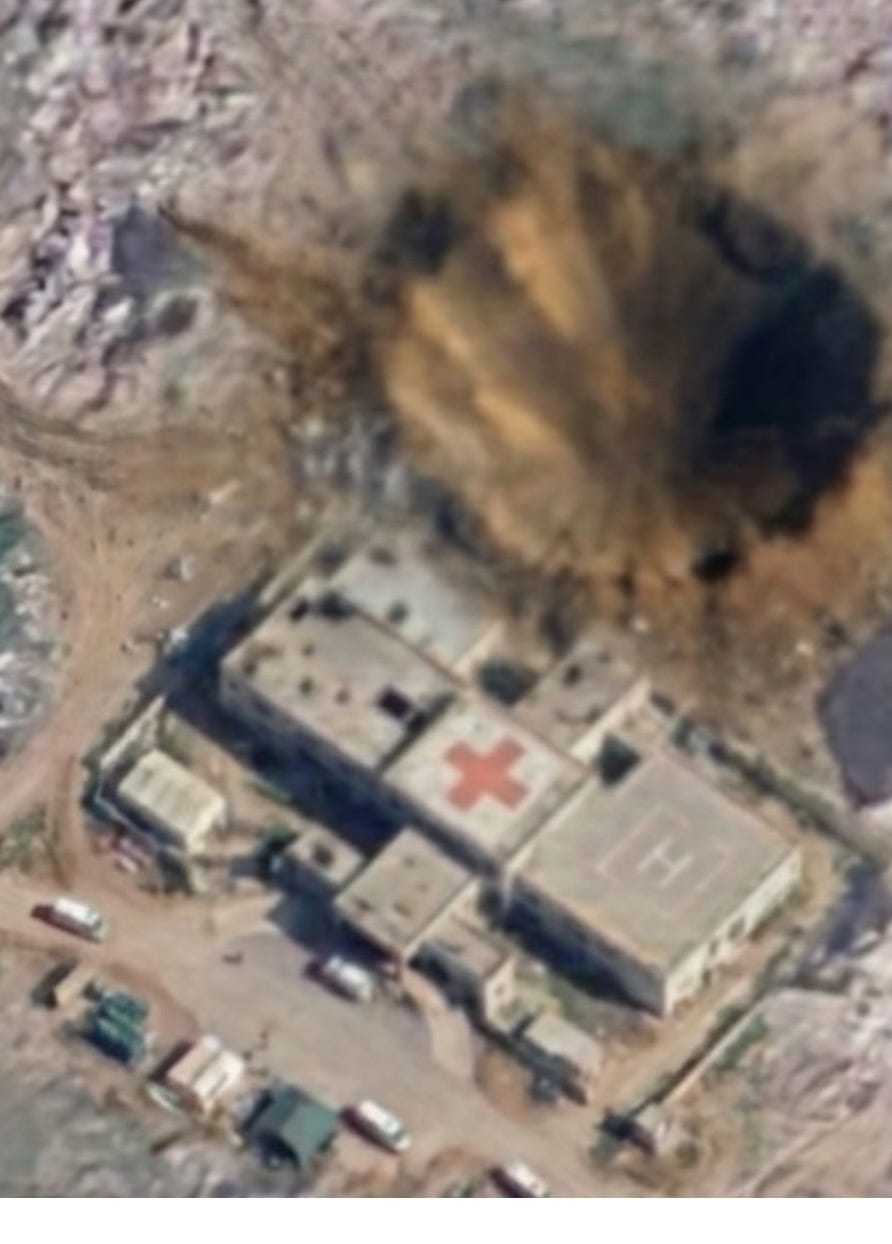
A government official wants a strike to look bigger than it was. A faction wants a hospital to look flattened, or intact, depending which one is holding it this week. A troll wants forty thousand reposts before lunch.
This morning all three needed a screenshot, a second browser tab and a little patience. Tonight they need a sentence.
Google responded to this article and said:
We take misinformation seriously - every image created with Nano Banana in Google Earth includes the SynthID digital watermark, so if someone is unsure about an image, they can ask the Gemini app or use Lens in Search to see if the image was Al-generated. In addition, we prevent image creation on harmful topics and are continually updating our protections.
One clause in there is checkable tonight, so I checked it. Google prevents image creation on harmful topics. Refugees at a border. A nuclear plant in Iran. A fatal crash on an Amsterdam street. A hospital with a bomb crater in Gaza.
Nothing was refused. No warning, no softened output, no suggestion to try a different prompt.
Now look at the rest of the answer. The watermark is Google’s. The app that reads the watermark is Google’s. The search that reads it is Google’s. Every road out of the problem runs back through the company that built it.
I understand that Google has Google products to run Google checks. Planet Earth is bigger than Google.
I put one of tonight’s clips on X and asked nobody to check it. Hive, one of the biggest names in AI detection outside Google, scanned the post on its own and published a verdict underneath.
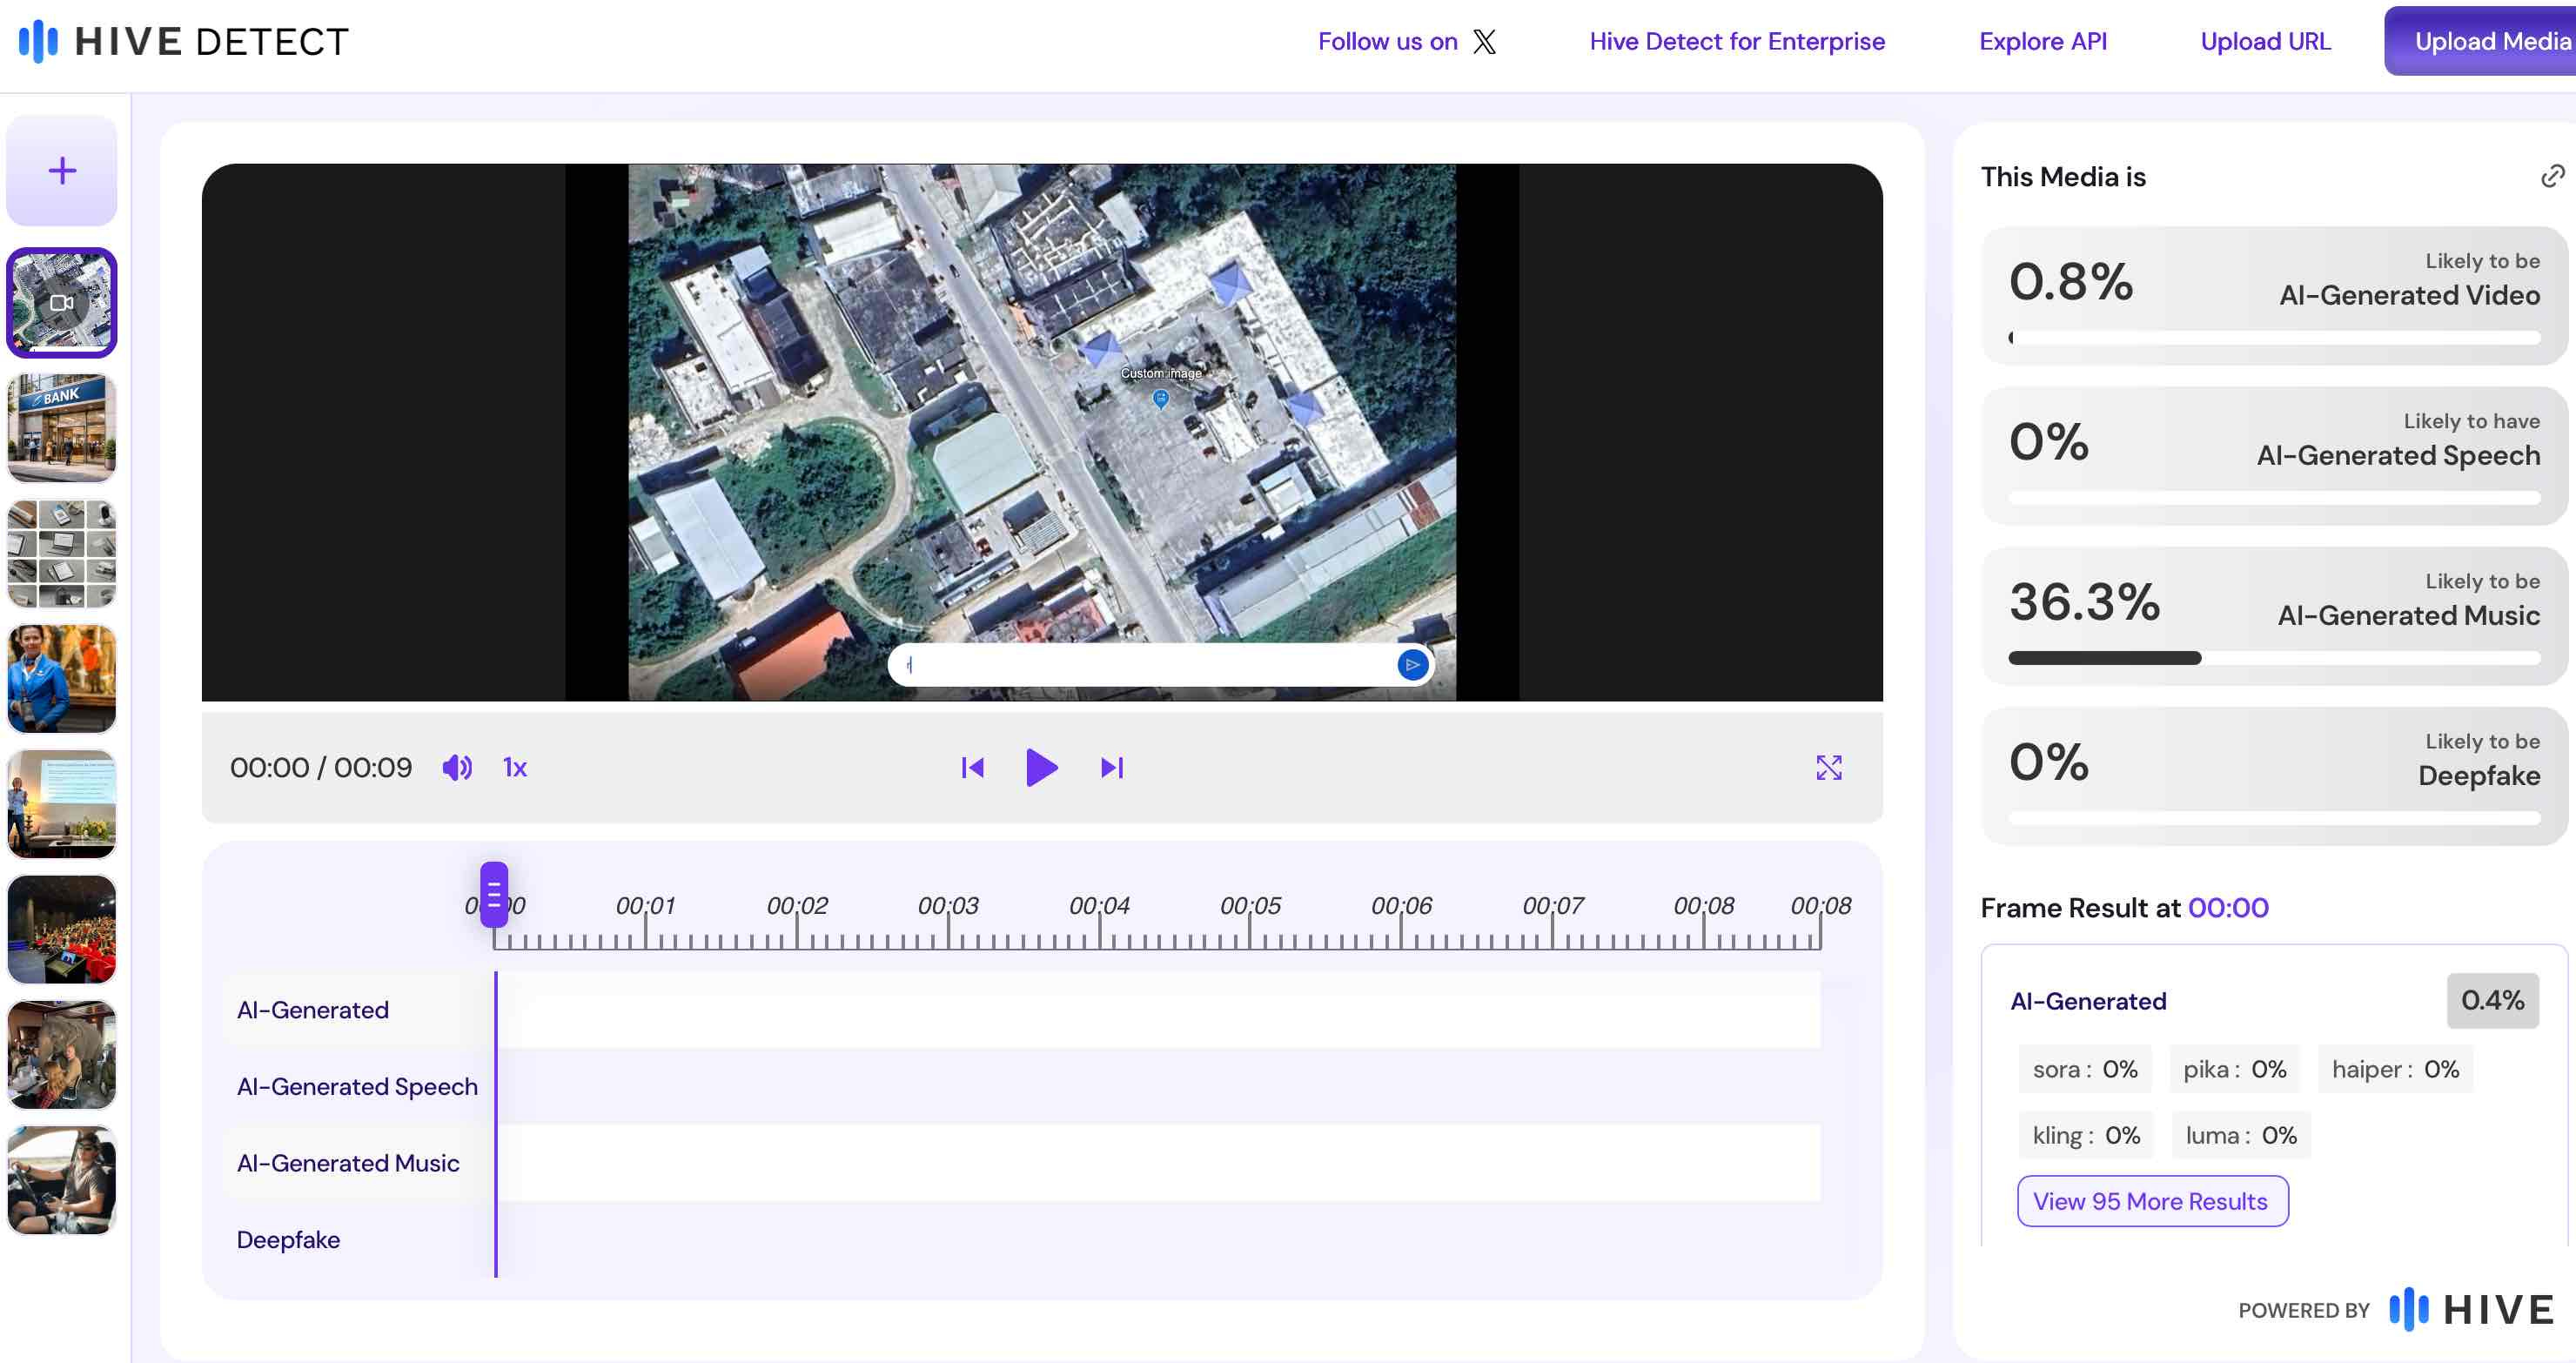
The video came out of Google’s model minutes earlier. The audio track is silence — I measured it. Minus 91 decibels, first frame to last.
The only thing Hive found suspicious was music that does not exist.
Hive has a defence and it is a fair one, so let me make it before they do. What I posted was a screen recording, and a recording of a screen is a real recording.
That defence is the problem, not the excuse.
Fakes do not travel as clean files with their credentials intact. They travel as screen recordings, re-encodes, screenshots of screenshots, filmed off somebody’s phone in a hurry. The one case where the detector has an excuse is the only case that ever happens.
Google’s answer works if the image reaches you through Google, unaltered, and you already suspected it.
That is not how any of this arrives.
There is another problem that Google doesn’t count. The official who now gets to look at a genuine photograph of a genuine atrocity and say: AI.
He doesn’t need the tool for that. He needs everyone to know the tool exists.
If you have never verified anything in your life, here is why a less playfull mapping app matters.
When a photograph turns up online claiming to show a bombed hospital, a refugee camp or a burning refinery, somebody has to decide whether it’s true before a newspaper prints it. What they have is a reference — a picture of that same place, taken from above or from the street, that everybody agrees is real.
They put the claim next to the reference and they look at the gap.
Google built that reference and it is not a small thing. Street View passed 10 million miles of road in 2019. It now holds more than 280 billion images across over 110 countries. Google Earth turned twenty this year. Between them they are a photographic record of the physical world, and — this is the part that matters — every frame of it is dated.
Dated is the whole trick. If you know when the picture was taken, you can prove when something appeared.
In July 2014 the Russian Ministry of Defence held a press conference and produced satellite images about the downing of MH17. Bellingcat compared them against the dated archive in Google Earth and found the landscape didn’t match the dates claimed. The MoD images were fabricated.
Bellingcat published the walkthrough under the headline Who to Trust, Google or the Russian MoD?
In 2015, that was a rhetorical question. Not anymore.
Volkel
There is a village in North Brabant, ninety minutes from my desk, called Volkel. It has an air base. That air base stores American B61 nuclear bombs, a fact the Dutch government has never confirmed, which became public through a leaked diplomatic cable and was later described by a former Dutch prime minister as absolutely pointless.
On Google’s maps, Volkel spent years as a rash of coloured pixels. So did the ammunition depot at Staphorst. So did a Patriot missile site in Limburg, and several royal palaces, because the Dutch approach to hiding a military installation was to paint a large abstract artwork on top of it. The photographer Mishka Henner collected them into a gallery and sold them as art, which tells you how well the hiding worked.
Tonight it is all in the open, and anyone who wants a missile site in Limburg can simply add one.
Now notice what that entire twenty-year argument assumed.
You only censor a map that works. Every blur, every polygon, every diplomatic request was an admission that Google Earth was accurate enough to be dangerous. Governments were not worried the map would lie. They were worried it would tell the truth.
Google’s position never wavered. It does not blur satellite imagery by choice. Sites come pre-obscured because a government or a supplier requires it as a condition of flying over.
So to take one real building out of Google Earth, you need a state.
To put a nuclear plant into Iran, I needed a sentence.
The asymmetry is not meant to be funny. For twenty years the danger was a map that revealed something true, and there was a procedure for that — a law, a ministry, a condition on the overflight permit. Tonight the danger is a map that shows something which was never there, and for that there is no procedure at all.
The cars nobody moved
Somebody already did the hard version of what I did tonight.
In February 2025 a Google Earth satellite pass photographed a parking lot at the US Navy’s Fifth Fleet headquarters in Manama, Bahrain. Ordinary cars, ordinary rows.
A year later those cars were on X, in a photograph of the same base supposedly flattened by an Iranian drone strike.
Same cars. Same rows. Same spaces, vehicle for vehicle.
Somebody generated a war zone and forgot to move the Toyotas.
The Tehran Times posted it as a before-and-after of a US radar site in Qatar. It was not Qatar. It was Bahrain. The “before” was a genuine Google Earth capture from 10 February 2025. The “after” was made with Google AI — AFP and BBC Verify both ran it through Google’s signature detector and got a hit. It passed 950,000 views before anyone counted the parking spaces.
Building it took six steps. Screenshot Earth. Open Gemini. Upload. Prompt. Download. Crop. Six chances to get bored, and one forger who got bored at the parking lot.
Tonight, Manama can be changed in seconds with Nano Banana.
How to fight this?
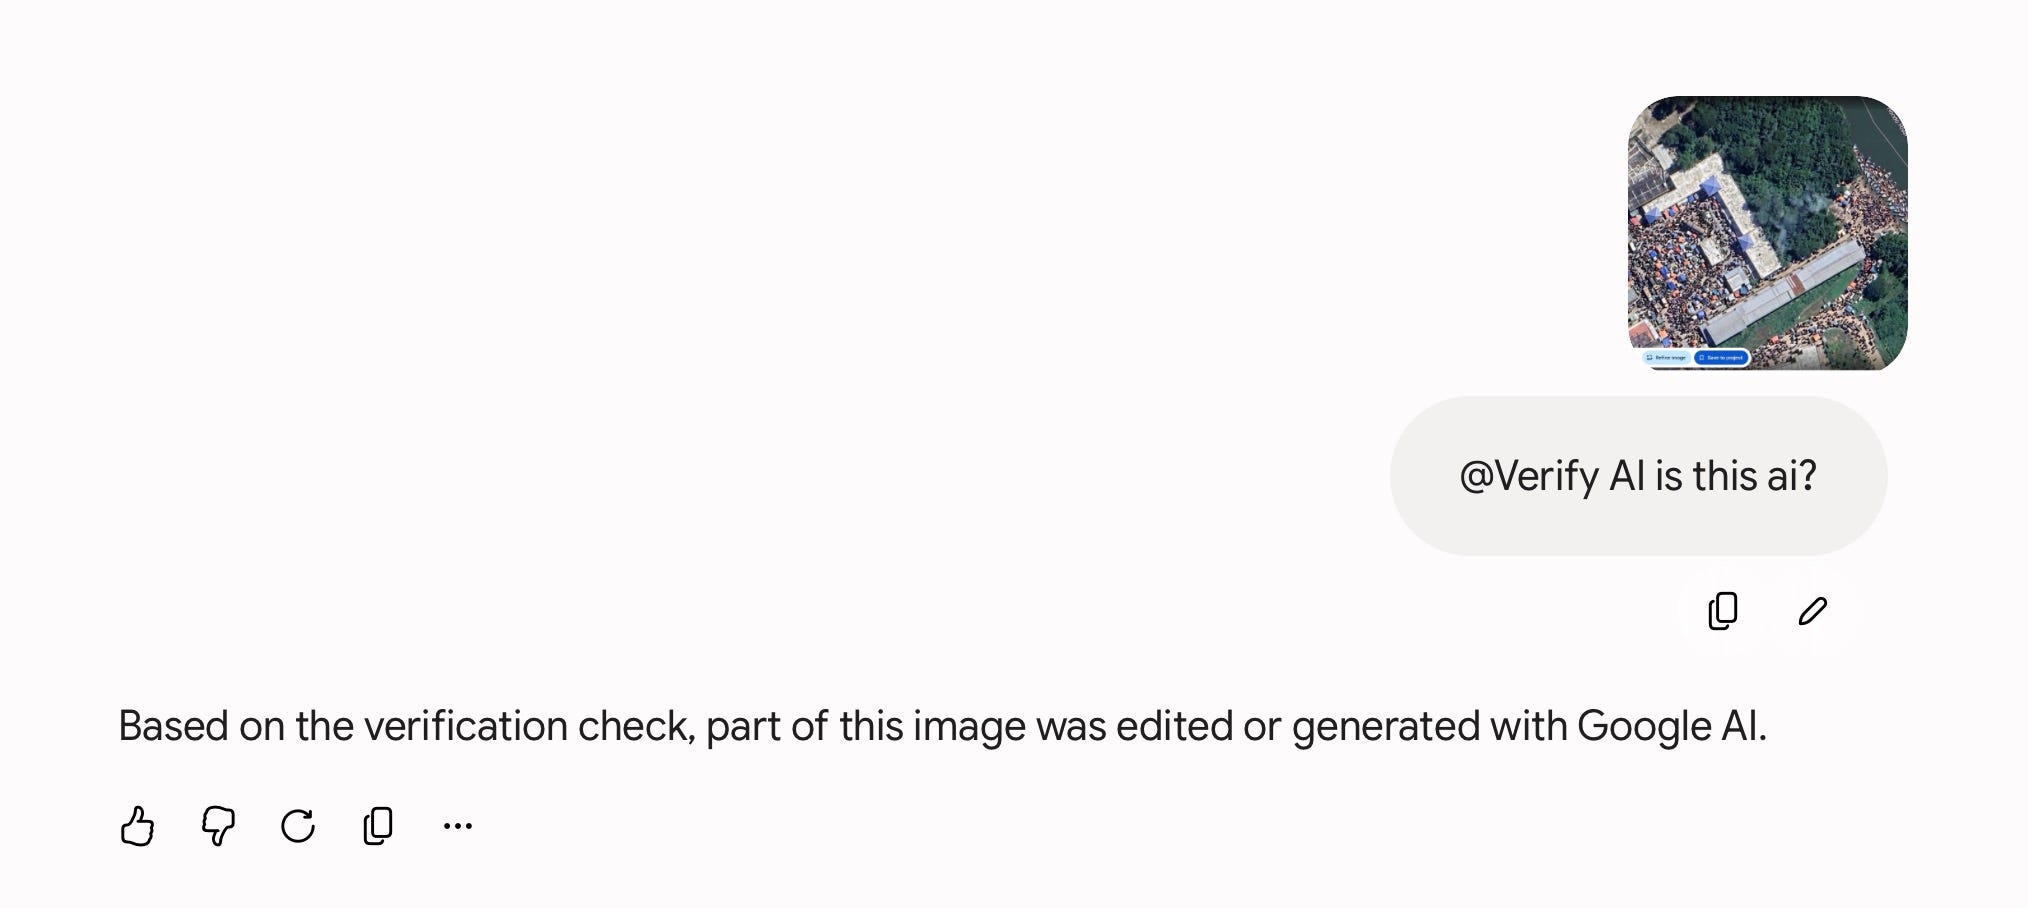
Upload a suspicious satellite image to Gemini, ad @verifyai and it will tell you if Google is behind the forgery.
Adjudicate off Google entirely. Sentinel-2 is free and refreshes every five or six days. Landsat, Planet, Airbus, Vantor. You want a sensor with an orbit, a collection time and a resolution you can check.
Take two collects. Todd Myers at the National Geospatial-Intelligence Agency said it before any of this existed: for every collect, you need a duplicate collect from different sources.
Check the orbit. If an image claims a specific satellite at a specific hour, the published orbital elements will tell you whether anything was up there. The most boring check in the toolkit, and the only one no model can fake, because it isn’t about the pixels.
Disclosure
I build ImageWhisperer. Google technology is part of it, not the whole of it. No single score is ever the finding.
Sources
Google, Transform any place with Nano Banana in Google Earth, Bryan Horowitz, 30 July 2026
Google Maps Platform, Street View Insights is now Generally Available — 280 billion images, 110+ countries, March 2026
TechRadar, Google says its Street View imagery now covers 10 million miles
Bellingcat, Who to Trust, Google or the Russian MoD? A Guide to Verifying Google Earth Satellite Image Dates
Bellingcat, MH17 — The Open Source Evidence
CNN, Google Maps: When censorship is beautiful — Mishka Henner, Dutch Landscapes
Live Science, 15 Secretive Places You Can Now See on Google Earth — Volkel Air Base
Google, We’re creating a new satellite imagery map to help protect Brazil’s forests
Forbes, Google Earth Users Get Powerful New AI Image Upgrade Today, 30 July 2026
Engadget, Nano Banana image generation comes to Google Earth, 30 July 2026
Dan Clark, How AI fakes are turning satellite images into war misinformation, Financial Times, 4 March 2026
AFP / CEDMO, Fake AI satellite imagery spurs US-Iran war disinformation
DW fact check, Fake satellite images distort Middle East conflict from above
European Commission, Transparency obligations under Article 50 of the AI Act
TechRadar, You can now ask the Gemini app if an image was made by AI
History & Archaeology Online, Did the Earthquake of 62AD lead to Pompeii’s Decline or Renewal?